Logging and Auditing
When tracking the health and performance of any system, metrics and logging are crucial. RustFS provides complete visibility into clusters through detailed storage performance monitoring, metrics, and logging of every operation. The result is a robust, transparent, and efficient answer to object storage monitoring, alerting, and observability.
Features
Monitoring Metrics
Provides complete system monitoring and performance metrics collection.
Logging
Records detailed log information for every operation, supporting audit trails.
Metrics Monitoring
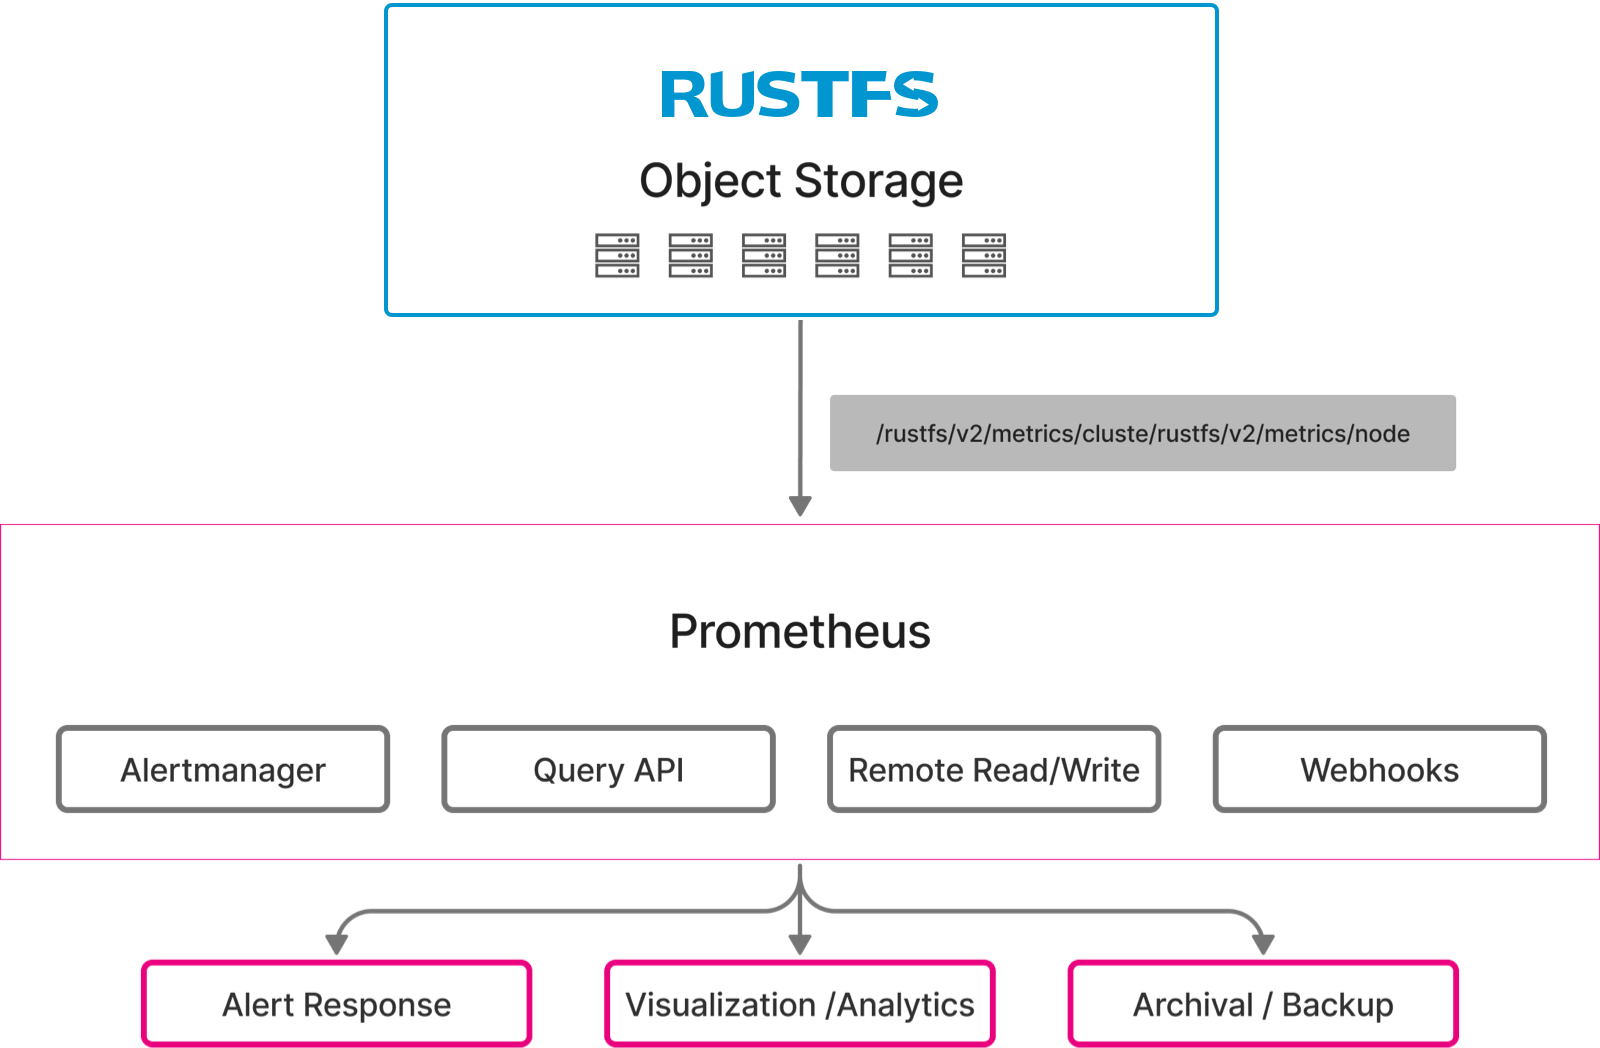
RustFS exports a wide range of fine-grained hardware and software metrics through Prometheus-compatible metrics endpoints. Prometheus is a cloud-native monitoring platform consisting of a multi-dimensional data model with time series data identified by metric names and key/value pairs. RustFS includes a storage monitoring dashboard that uses Grafana to visualize collected metrics. The Prometheus ecosystem includes multiple integrations for routing RustFS metrics to storage, messaging, and alerting services.
RustFS displays various fine-grained hardware and software metrics through Prometheus endpoints, including health information such as disk or node failures, total available storage capacity, and storage capacity per disk. By leveraging Prometheus and its growing popularity as a leading metrics collection and analysis platform, RustFS can focus on its object storage functionality rather than building countless custom data storage monitoring adapters for given third-party analysis/visualization/alerting services.
The RustFS Kubernetes Operator can automatically deploy, configure, and manage Prometheus deployments and metrics collection for each tenant. Organizations can also point their own Prometheus or Prometheus-compatible systems to each tenant for centralized monitoring across multiple vendors, data centers, and visualization/analysis tools.
RustFS also provides a health check endpoint for probing node and cluster liveness. A simple CURL statement can indicate whether a given node is healthy or whether the cluster has read/write quorum.
Audit Logs
Enabling RustFS audit logging instructs RustFS to generate logs for every operation on the cluster. Each operation generates an audit log containing a unique ID and detailed information about the client, object, bucket, and all other metadata related to the operation. RustFS writes log data to configured HTTP/HTTPS webhook endpoints. Custom adapters can be used to meet specific requirements of audit logging targets.
RustFS supports configuring audit logs through the RustFS Console UI and the RustFS mc command-line tool. For Kubernetes environments, the RustFS Operator automatically configures the console with LogSearch integration for visual inspection of collected audit logs.
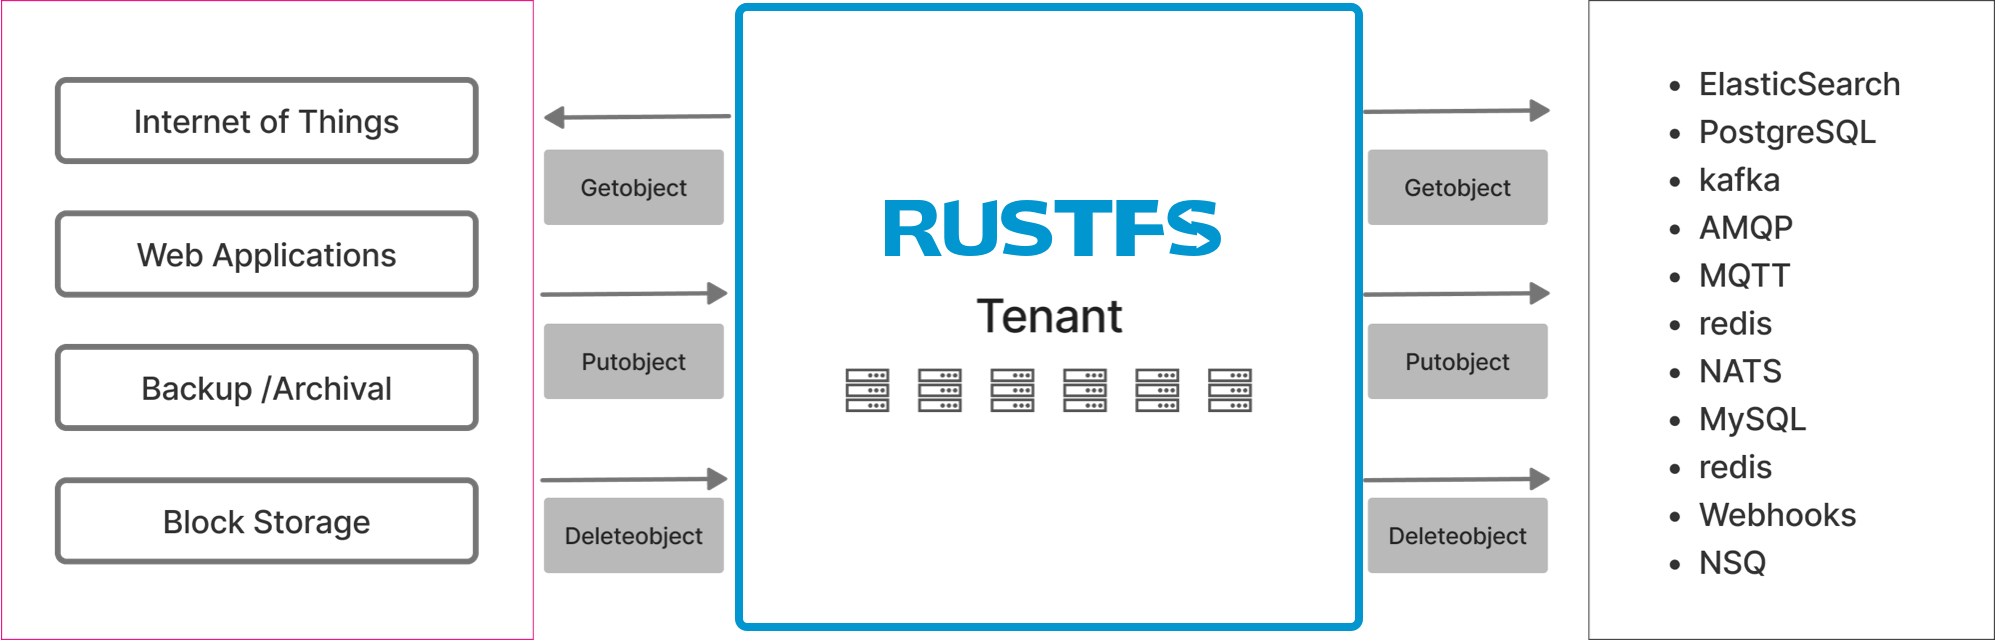
RustFS Lambda notifications provide additional logging support. RustFS can automatically send bucket and object events to third-party applications for event-driven processing, such as serverless or function-as-a-service computing frameworks. RustFS Lambda notifications support targets such as RabbitMQ, Kafka, Elasticsearch, and arbitrary services through webhooks.
RustFS also supports real-time tracing of HTTP/S operations through the RustFS Console and RustFS mc admin trace shell commands.
Architecture
RustFS exposes its metrics through Prometheus-compatible HTTP(S) endpoints, where Prometheus services provide push/pull access to these metrics. The RustFS Kubernetes Operator deploys an independent Prometheus service for each pre-configured RustFS tenant to scrape tenant metrics. Organizations can also deploy or leverage their own centralized Prometheus services to scrape tenant metrics.
RustFS Lambda notifications automatically push event notifications to supported target services such as Kafka, Elasticsearch, or PostgreSQL. Administrators can define bucket-level notification rules that include fine-grained filters for S3 events and objects for which RustFS generates events. RustFS Lambda notifications are built into the RustFS object storage service and only require access to remote notification targets.
Requirements
For Metrics
BYO Prometheus or use Kubernetes Operator to automatically deploy/configure for each tenant.
For Log Search
BYO PostgreSQL or use Kubernetes Operator to automatically deploy/configure for each tenant.
For Logs
Support for third-party notification targets.